During designing buildings, architects and engineers usually do climate analysis as one of their initial steps. To conduct climate analysis, they utilize weather data analysis and visualization software such as Climate Consultant and DView. Although the software is free, the visualization options are limited and there is no interactive option once the visualization graphics are produced. As a result, most of architects use similar graphic presentations.
To avoid the issue and provide more powerful weather data visualization, Tableau, data visualization software, can be used as an alternate tool. Although there are pre process data and limitations because Tableau was not designed specifically for weather data analysis, Tableau can provide more interesting data visualization and analysis for weather data.
To test its capability, I use Tableau public version to visualize a weather file in Vietnam. You can see these following data visualization images that you can generate with Tableau:
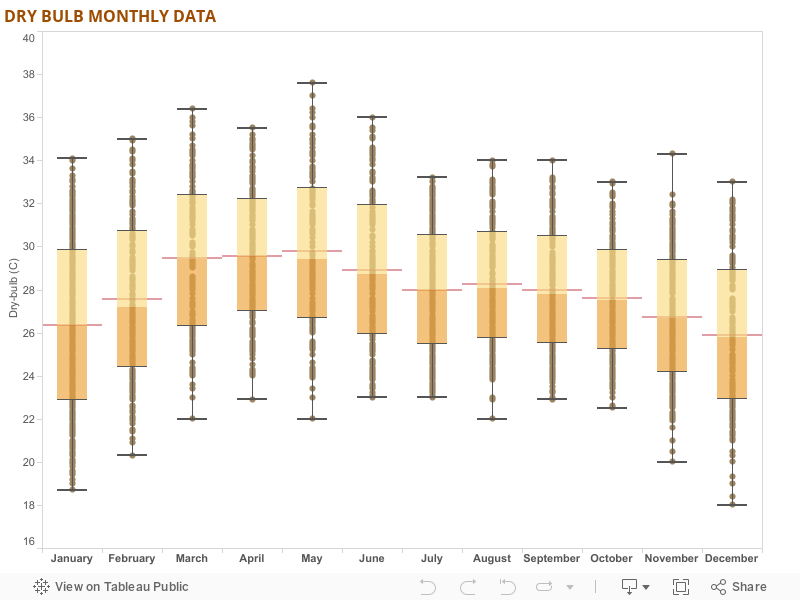
1. Dry Bulb Monthly Data
The image has similar style with Climate Consultant, but using Tableau, you can hover the data and collect the detail information easily.
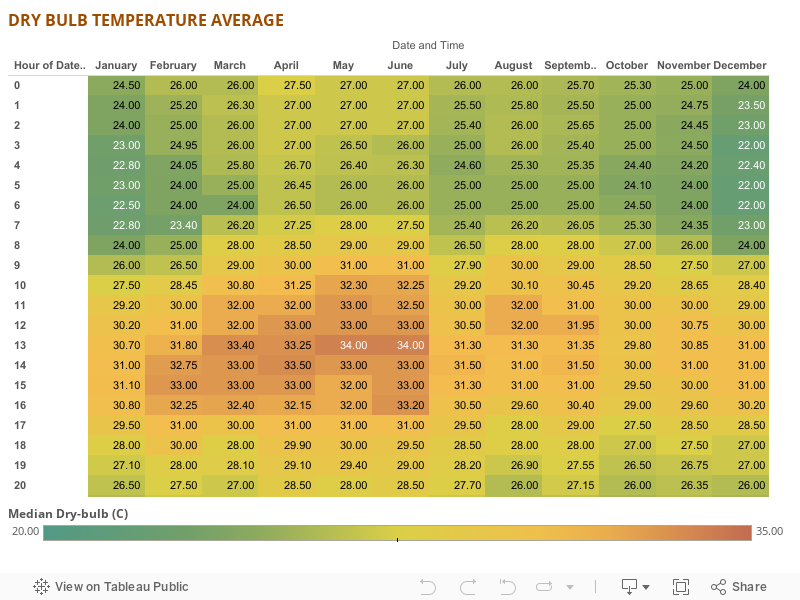
2. Dry Bulb Temperature Average Data
The average data can be generated easily and using different color, the different temperature can be perceived easily. Different color and different data type (average or median) can be utilized easily using Tableau.
3. Wind Direction and Wind Speed (Median)
Mapping wind direction and wind speed from weather data is not an easy task. Typical weather analysis and viewers mostly focus on aggregated data that make harder to really understand the behavior of the wind. This chart can be used to used as one alternative to understand the prevailing wind and its speed.
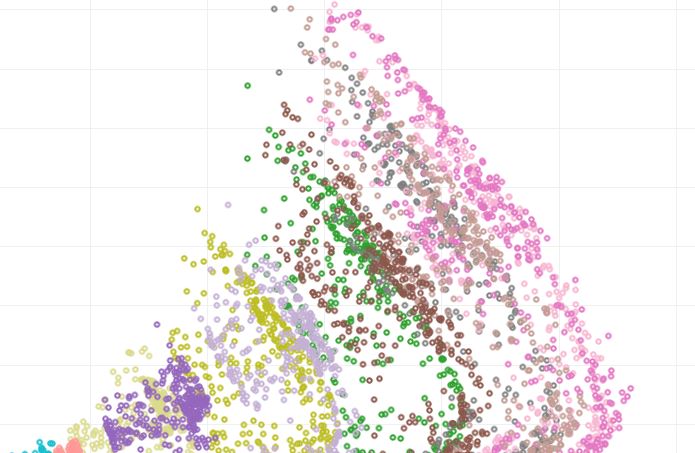
4. Dry Bulb and Relative Humidity
Using color to visualize the temperature data and using circle size to visualize the relative humidity are very helpful to understand typical yearly condition in the location. A slider can easily added to filter the data.
5. Global Horizontal Irradiance
Yearly average Global Horizontal Irradiance can be generated with combining different color and even average data in the image directly. Different monthly filter can enhance the data representative to sort the data in the specific months.
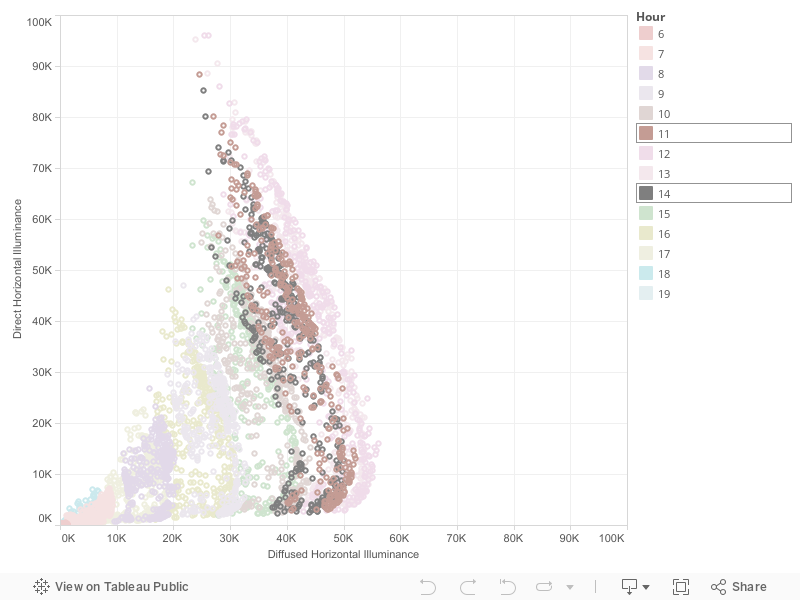
6. Diffused and Direct Horizontal Illuminance
The data visualization for both data can represent in one chart. In addition to data visualization, Tableau is also capable to apply calculation formula to generate certain data such as direct horizontal illuminance in this chart. A filter to see any specific months will help understand sky conditions.
Looking its capability, Tableau can definitely be used as alternative tool in weather data visualization and analysis. Its interactive and customization visualization bring unique value to assist architects or engineers to understand weather in site location better. It can compliment existing data and weather data visualization.
*This is a personal blog. The opinions expressed here represent my own and not those of my employer. The author does not receive cash payment from the company or own any Tableau stocks, while writing this blog
4 thoughts on “Using Tableau, Interactive Data Visualization Software, for Weather Data Analysis and Visualization”
Awesome work man!
Hi,
I am very impressed with your work using tableau. Could you please help me out to create above charts/ interactive visualisation. I need this for my Project assignments on Data Visualisation. I have a copy of tableau (student’s version)
Thanks,
Prateek
Dublin, Ireland
Hi Prateek, the process is straight forward. The first step is that you need make a clean data set to be used. There are several guideline in official Tableau Software in youtube.
Thanks,
Could you please send me the procedure/steps to generate the above bubble chart(Dry Bulb Temp vs Humidity)
Thanks,
Prateek
(PS: I have a good exposure in language ‘R’ )